
Case study
Analyzing and Modeling historic sales data to predict future wins
tl;dr
Providing an inaccurate sales forecast for a rep, a team, or a company can have disastrous consequences.
I’ve worked in sales engineering for over 10 years and have an intuition for predicting which deals we’ll win or lose, but wanted to bring more rigor and more statistical confidence to sales forecasts, to shape more targeted and impactful sales strategies.
I built a series of Python scripts that analyze, prepare, and model historical sales data to predict the probability that a specific future sales opportunity will be won or lost.
The final model has a Brier Skill Score of 0.60, meaning it can predict the probability of a deal being won with strong accuracy.
Business problems
-
Sales forecasting has always been difficult and typically requires veteran sales leaders to interrogate sales reps about their active deals. Sales reps and leaders that routinely forecast sales inaccurately, even if they bring in more money than they predicted, are often subject to scrutiny or, in extreme cases, disciplinary action.
-
Forecasting is time consuming and requires seasoned sales leaders’ time to get accurate results.
-
Inaccurate sales forecasts can lead to inaccurate earnings calls for a company, which can have negative effects on stock prices and relationships with investors. This makes sense, on some level: if a company can’t accurately forecast or predict sales with all the data they have, why should an investor trust their ability to execute elsewhere?
-
An individual sales rep’s most important resource is time. They have more accounts and customers to contact than they will ever have time for, so properly allocating their time between different activities and sales opportunities is extremely important. If sales reps spend their time pursuing opportunities that are not a good use of their time and have a low probability of closing, they won’t come close to achieving their quota - nor will they drive as much revenue for the business.
High level methods
Data source
I used a sales data set from Kaggle for model training data, but anyone could use my scripts to train a custom model based on their own company’s CRM data. My scripts require the data to be in a specific format, but a data scientist or engineer could reformat their company’s data to make it work with my code.
Problem type
Sales opportunities are either won or lost, so I approached this work as a binary classification problem to solve.
Primary metric
Since the output was probability and the class was imbalanced, the ideal method to measure performance was the Brier Score Loss. However, since the BSL is a loss function- it is relative to the class balance and difficult to interpret. I used a modified version- the Brier Skill Score.
The BSS is also used to evaluate weather forecasting models, which is similar to my goal. Higher scores are better, the ideal is 1.0, and zero is the same as random chance. In weather forecasting, a Brier Skill Score of 0.05 is considered a good forecast quality. My model’s Brier Skill Score was 0.60.
Exploratory data analysis
My EDA showed that this dataset suffered from similar issues I had seen before.
I identified three influential sales workflows and challenges that I needed to account for in preparing the data for my model.
-
Sales reps often duplicate a sales opportunity in a CRM as a workaround to do things like generate a new quote for prospects. I located many of these by searching for long-running lost opportunities, quickly followed by a new opp for the same customer that is won in an unreasonably short amount of time.
Without adjusting for this behavior, an ML model would falsely believe that large and/or complex deals can be won in 3-14 days, when it was really 90-180 days.
-
Some sales reps create very low quality opps that never had a real chance of being won. I've seen when early career sales reps “wear happy ears”. They create opps when they think they're a genuine opportunity, but they didn't do enough discovery. Usually, the prospect wasn’t going to buy anything, even from competitors.
Because the opp should not have been created in the first place—there was never a winnable deal. Including these opps in the model would deflate projected win rates.
-
Some sales leaders pressure sales reps to generate lots of pipeline, assuming they'll convert (win) about one third of the total pipelined revenue across the sales org. Since reps are often measured by pipeline generation, a few reps may intentionally create “fake pipe” by closing out an old opp and then recreating nearly the same thing as a new opp. This artificially deflates the win rate in a model since it creates duplicates of lost opps.
I identified and removed these by looking for sales reps that had a very low win rate but high pipeline generation, especially for back to back opps with the same customer.
Data analyis findings
-
Feature correlation and data leakage
Finding feature to feature correlations can be helpful for business level insight, but can also be used to remove redundant features that cause poor modeling performance.
I standardized the data and then created a correlation matrix to find business level insights listed below.
Adding partners to deals increased the number of times the opp’s close date pushed out
Larger opps took longer to close
Larger deals tended to get pushed more frequently
Partners had a tendency to increase the deal size
-
Strongest influences on winning/losing - label correlation
Adding partners increased the odds of winning
If the company was leading with Product B, the odds of winning went up.
SaaS products, and products in general increased the odds of winning deals over on-prem and service offerings.
Data preparation
-

Feature Enhancements
Using my 10+ years of sale experience, I used the existing data to derive new features that would provide additional insight.
Ex: Whether the offering is SaaS or on-prem, subscription or perpetual, and service or product has an influence on the selling motion and winning likelihood. I implemented new features (columns) that gave more context to the model and increased performance.
-

Deal with outliers
Drop opportunities that had values outside reasonable values.
Ex: Deals listed as $2,000,000 for a small company probably aren’t real and should be removed.
Ex: Deals that were open for 3 years and lost were never real and should be removed.
Clip and winsorize reasonable outliers.
Ex. All deals under $10,000 are run the same way, so just make them all $10k.
-

Standardize numeric features
Standardizing gives all features an equal opportunity to influence the outcome. Without standardizing, the biggest number is the most influential. In that case, the model would rely almost exclusively on revenue and ignore other deal factors.
Ex. All deals must be between $10k and $200k. $10k deals are mapped to 0.0 and $200k deals are mapped to 1.0.
-

Balancing the data
The original dataset represented reality well, in which only a quarter of deals were won, but training models requires a more balanced representation of each possible outcome. Without balance, the model only gets exposure to what losses look like and has a harder time finding patterns in what makes an opp win.
Ex: I upsampled the wins to give the dataset more "class balance", and the performance significantly improved.
-

Dimensionality Reduction
My dataset now had 322 features (columns) after the necessary step of One Hot Encoding to make text fields like Rep Names usable. I performed dimensionality reduction using Principal Component Analysis to avoid "the curse of dimensionality". PCA transformed my dataset into a new set of features where I only needed 5.
PCA slashed training times and memory requirements while significantly boosting performance metrics. The drawback was increased coding complexity and decreased explainability, but it was worth it.
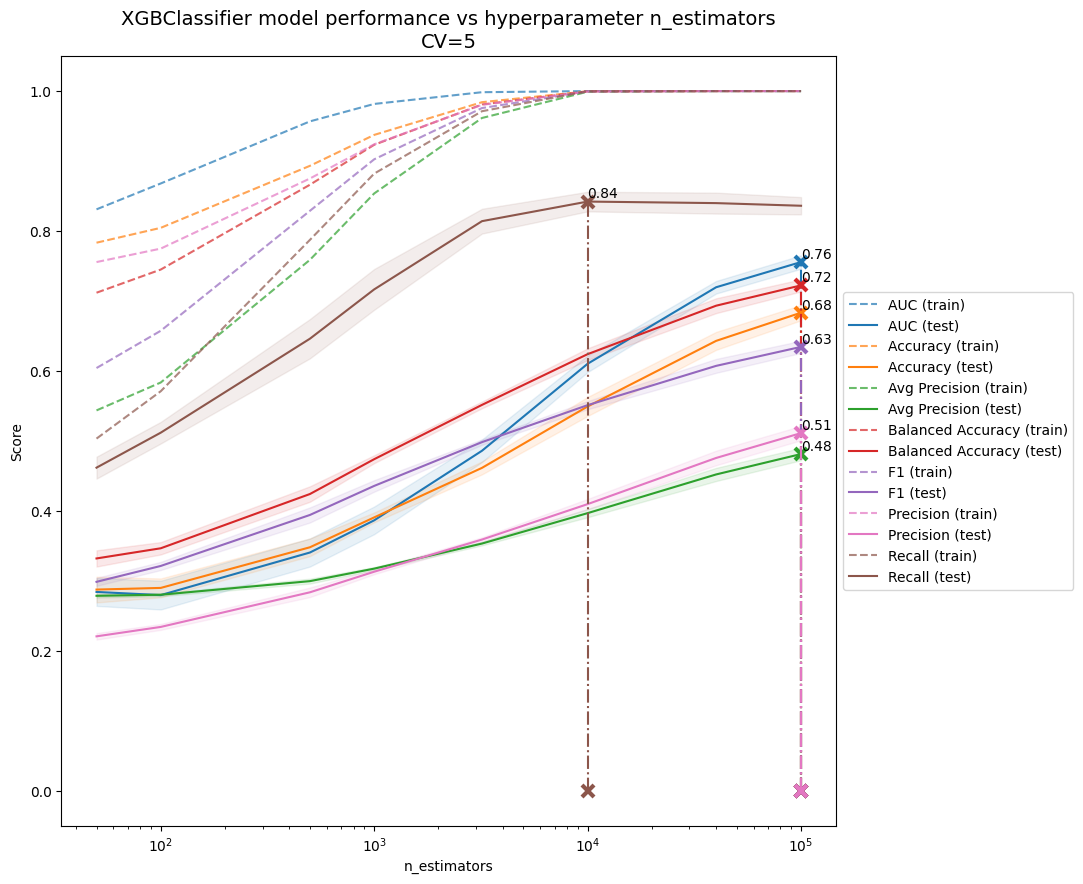
Optimizing the model
Since this is a binary classification problem, I used XGBoost’s XGBClassifier estimator (an industry standard). GridSearchCV iterated through a variety of hyperparameters to optimize the Brier Score Loss, but I recorded and plotted other secondary metrics as well.
Model performance was most clearly illustrated when plotted against num_estimators (left).
Takeaways
Win rate is most influenced by shorter deal cycles, having a partner involved, and which product is being positioned. The individual sales rep, territories, and sales managers had a smaller influence.
About 80% of the probability of a deal being won is determined by a small number of CRM fields, and not all of them are needed for modeling.
Companies could easily train this model using their own CRM data, and private data such as customer names or employee names are not needed or could be masked.